Optical_microscope Microscope is an instrument to see objects too small for the naked eye. The science of investigating small objects using such an instrument is called microscopy. Microscopic means invisible to the eye unless aided by a microscope. There are many types of microscopes, the most common and first to be invented is the optical microscope which uses light to image the sample. Other major types of microscopes are the electron microscope (both the transmission electron microscope and the scanning electron microscope) and the various types of scanning probe microscope.The first detailed account of the interior construction of living tissue based on the use of a microscope did not appear until 1644, in Giambattista Odierna's L'ochio della mosca, or The Fly's Eye. It was not until the 1660s and 1670s that the microscope was used extensively for research in Italy, Holland and England. Marcelo Malpighi in Italy began the analysis of biological structures beginning with the lungs. Robert Hooke's Micrographia had a huge impact, largely because of its impressive illustrations. A greatest contribution came from Antoni van Leeuwenhoek who discovered red blood cells and spermatozoa and helped popularise microscopy as a technique. On 9 October 1676, Leeuwenhoek reported the discovery of micro-organisms. In 1893 August Köhler development a key technique for sample illumination, Köhler illumination, which is central to modern light microscopy. This method of sample illumination gives rise to extremely even lighting and overcomes many limitations of older techniques of sample illumination. Further developments in sample illumination came from Fritz Zernike in 1953 and George Nomarski 1955 for their development of phase contrast and differential interference contrast illumination which allow imaging of transparent samples. Electron microscopy In the early 1900s a significant alternative to light microscopy was developed, using electrons rather than light to generate the image. Ernst Ruska started development of the first electron microscope in 1931 which was the transmission electron microscope (TEM). The transmission electron microscope works on the same principle as an optical microscope but uses electrons in the place of light and electromagnets in the place of glass lenses. Use of electrons instead of light allows a much higher resolution. Development of the transmission electron microscope was quickly followed in 1935 by the development of the scanning electron microscope by Max Knoll. Electron microscopes quickly became popular, following the Second World War Ernst Ruska, working at Siemens developed the first commercial transmission electron microscope and major scientific conferences on electron microscopy started being held in the 1950s. In 1965 the first commercial scanning electron microscope was developed by Professor Sir Charles Oatley and his postgraduate student Gary Stewart and marketedCambridge Instrument Company as the "Stereoscan". Scanning probe microscopy The 1980s saw the development of the first scanning probe microscopes. The first was the scanning tunneling microscope in 1981, developed by Gerd Binnig and Heinrich Rohrer. Whis was closely followed in 1986 with Gerd Binnig, Quate, and Gerber's invention of the atomic force microscope. Fluorescence and light microscopy The most recent developments in light microscope largely centre on the rise of fluorescence microscopy in biology. During the last decades of the 20th century, particularly in the post- genomic era, many techniques for fluorescent labeling of cellular structures were developed. The main groups of techniques are small chemical staining of cellular structures, for example DAPI to label DNA, use of antibodies conjugated to fluorescent reporters, see immunofluorescence, and fluorescent proteins, such as green fluorescent protein. These techniques use these different fluorophores for analysis of cell structure at a molecular level in both live and fixed samples. The rise of fluorescence microscopy drove the development of a major modern microscope design, the confocal microscope. The principle was patented in 1957 by Marvin Minsky, although laser technology limited practical application of the technique. It was not until 1978 when Thomas and Christoph Cremer developed the first practical confocal laser scanning microscope and the technique rapidly gained popularity through the 1980s. Main article: Microscopy#Sub- diffraction techniques Much current research (in the early 21st century) on optical microscope techniques is focused on development of superresolution analysis of fluorescently labeled samples. Structured illumination can improve resolution by around two to four times and techniques like stimulated Emission Depletion microscopy are approaching the resolution of electron microscopes. Types Types of microscopes Microscopes can be separated into several different classes. One grouping is based on what interacts with the sample to generate the image, i.e. light (optical microscopes), electrons (electron microscopes) or a probe (scanning probe microscopes). Alternatively microscopes can be classed on whether they analyse the sample via a scanning point (confocal optical microscopes, scanning electron microscopes and scanning probe microscopes) or analyse the sample all at once (wide field optical microscope and transmission electron microscopes). The wide field optical microscope and transmission electron microscope use the theory of lenses ( optics for light microscopes and electromagnet lenses for electron microscopes) in order to magnify the image generated by the passage of a wave through the sample, or reflected by the sample. The waves used are electromagnetic (in optical microscopes) or electron beams (in electron microscopes). Resolution in these microscopes is limited by the wavelength of the radiation used to image the sample, shorter wavelengths allow a higher resolution. Scanning optical and electron microscopes, like the confocal microscope and scanning electron microscope, use lenses to focus a spot of light/electrons onto the sample then analyse the reflected and/or transmitted waves. The point is then scanned over the sample to analyse a rectangular region. Magnification of the image is achieved by displaying the data from scanning a small sample area on a large screen. These microscopes have the same resolution limit as wide field optical and electron microscopes. Scanning probe microscopes also analyse a single point in the sample and then scan the probe over a rectangular sample region to build up an image. As these microscopes do not use electromagnetic or electron radiation for imaging they are not subject to the same resolution limit as the optical and electron microscopes described above. Optical Main article: Optical microscope The most common type of microscope —and the first invented —is the optical microscope. This is an optical instrument containing one or more lenses producing an enlarged image of an sample placed in the focal plane. Optical microscopes have refractive glass and occasionally of plastic or quartz, to focus light into the eye or another light detector. Mirror-based optical microscopes operate in the same manner. Typical magnification of a light microscope, assuming visible range light, is up to 1500x with a theoretical resolution limit of around 0.2 micrometres or 200 nanometers. Specialized techniques (e.g., scanning confocal microscopy, Vertico SMI) may exceed this magnification but the resolution is diffraction limited. The use of shorter wavelengths of light, such as the ultraviolet, is one way to improve the spatial resolution of the optical microscope, as are devices such as the near-field scanning optical microscope . Sarfus, a recent optical technique increases the sensitivity of standard optical microscope to a point it becomes possible to directly visualize nanometric films (down to 0.3 nanometer) and isolated nano- objects (down to 2 nm-diameter). The technique is based on the use of non-reflecting substrates for cross- polarized reflected light microscopy.
Saturday, August 7, 2010

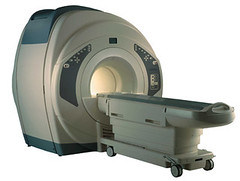
PET scanner
Sun 01/08/2010 13:06 PET-Scanner Positron emission tomography (PET) is a nuclear medicine imaging technique which produces a three- dimensional image or picture of functional processes in the body. The system detects pairs of gamma rays emitted indirectly by a positron-emitting radionuclide (tracer), which is introduced into the body on a biologically active molecule. Images of tracer concentration in 3-dimensional or 4- dimensional space (the 4th dimension being time) within the body are then reconstructed by computer analysis. In modern scanners, this reconstruction is often accomplished with the aid of a CT X-ray scan performed on the patient during the same session, in the same machine. If the biologically active molecule chosen for PET is FDG, an analogue of glucose, the concentrations of tracer imaged then give tissue metabolic activity, in terms of regional glucose uptake. Although use of this tracer results in the most common type of PET scan, other tracer molecules are used in PET to image the tissue concentration of many other types of molecules of interest.

Saturday, May 1, 2010
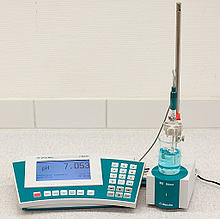
pH meter
pH_Meter A pH meter is an electronic instrument used to measure the pH (acidity or alkalinity) of a liquid (though special probes are sometimes used to measure the pH of semi-solid substances). A typical pH meter consists of a special measuring probe (a glass electrode) connected to an electronic meter that measures and displays the pH reading.THE PROBEThe pH probe measures pH as the activity of hydrogen ions surrounding a thin-walled glass bulb at its tip. The probe produces a small voltage (about 0.06 volt per pH unit) that is measured and displayed as pH units by the meter. For more information about pH probes, see glass electrode.THE METERThe meter circuit is no more than a voltmeter that displays measurements in pH units instead of volts. The input impedance of the meter must be very high because of the high resistance — approximately 20 to 1000 MΩ — of the glass electrode probes typically used with pH meters. The circuit of a simple pH meter usually consists of operational amplifiers in an inverting configuration, with a total voltage gain of about -17. The inverting amplifier converts the small voltage produced by the probe (+0.059 volt/pH) into pH units, which are then offset by seven volts to give a reading on the pH scale. For example: At neutral pH (pH 7) the voltage at the probe's output is 0 volts. 0 * 17 + 7 = 7. At basic pH, the voltage at the probe's output ranges from +0 to +0.41 volts (7 * 0.059 = 0.41). So for a sample of pH 10 (3 pH units above neutral), 3 * 0.059 = 0.18 volts), the output of the meter's amplifier is 0.18 * 17 + 7 = 10. At acid pH, the voltage at the probe's output ranges from -0.41 volts to -0. So for a sample of pH 4 (3 pH units below neutral), -3 * 0.059 = -0.18 volts, the output of the meter's amplifier is -0.18 * 17 + 7 = 4. The two basic adjustments performed at calibration (see below) set the gain and offset of the inverting amplifier.CALIBRATION AND USE For very precise work the pH meter should be calibrated before each measurement. For normal use calibration should be performed at the beginning of each day. The reason for this is that the glass electrode does not give a reproducible e.m.f. over longer periods of time. Calibration should be performed with at least two standard buffer solutions that span the range of pH values to be measured. For general purposes buffers at pH 4 and pH 10 are acceptable. The pH meter has one control (calibrate) to set the meter reading equal to the value of the first standard buffer and a second control (slope) which is used to adjust the meter reading to the value of the second buffer. A third control allows the temperature to be set. Standard buffer sachets, which can be obtained from a variety of suppliers, usually state how the buffer value changes with temperature. The calibration process correlates the voltage produced by the probe (approximately 0.06 volts per pH unit) with the pH scale. After each single measurement, the probe is rinsed with distilled water or deionized water to remove any traces of the solution being measured, blotted with a clean tissue to absorb any remaining water which could dilute the sample and thus alter the reading, and then quickly immersed in another solution. When not in use, the probe tip must be kept wet at all times. It is typically kept immersed in an acidic solution of around pH 3.0. In an emergency, acidified tap water can be used, but distilled or deionised water must never be used for longer-term probe storage as the relatively ionless water "sucks" ions out of the probe through diffusion, which degrades it. Occasionally (about once a month), the probe may be cleaned using pH-electrode cleaning solution; generally a 0.1 M solution of Hydrochloric Acid (HCl) is used , having a pH of about one. TYPES OF pH METERSpH meters range from simple and inexpensive pen-like devices to complex and expensive laboratory instruments with computer interfaces and several inputs for indicator ( ion- sensitive, redox), reference electrodes, and temperature sensors such as thermoresistors or thermocouples. Cheaper models sometimes require that temperature measurements be entered to adjust for the slight variation in pH caused by temperature. Specialty meters and probes are available for use in special applications, harsh environments, etc. Pocket pH meters are readily available today for a few tens of dollars that automatically compensate for temperature (ATC, Automatic Temperature Compensation)
Saturday, April 10, 2010
Magnetic resonance imaging (MRI)
Magnetic resonance imaging (MRI) Magnetic resonance imaging , or nuclear magnetic resonance imaging (NMRI), is primarily a medical imaging technique most commonly used in radiology to visualize detailed internal structure and limited function of the body. MRI provides much greater contrast between the different soft tissues of the body than computed tomography (CT) does, making it especially useful in neurological (brain), musculoskeletal, cardiovascular, and oncological (cancer) imaging. Unlike CT, it uses no ionizing radiation, but uses a powerful magnetic field to align the nuclear magnetization of (usually) hydrogen atoms in water in the body. Radio frequency (RF) fields are used to systematically alter the alignment of this magnetization, causing the hydrogen nuclei to produce a rotating magnetic field detectable by the scanner. This signal can be manipulated by additional magnetic fields to build up enough information to construct an image of the body. Magnetic resonance imaging is a relatively new technology. The first MR image was published in 1973 and the first cross- sectional image of a living mouse was published in January 1974. The first studies performed on humans were published in 1977. By comparison, the first human X-ray image was taken in 1895. Magnetic resonance imaging was developed from knowledge gained in the study of nuclear magnetic resonance. In its early years the technique was referred to as nuclear magnetic resonance imaging (NMRI). However, because the word nuclear was associated in the public mind with ionizing radiation exposure it is generally now referred to simply as MRI. Scientists still use the term NMRI when discussing non-medical devices operating on the same principles. The term magnetic resonance tomography (MRT) is also sometimes used. WORKING Main article: Physics of Magnetic Resonance Imaging The body is largely composed of water molecules which each contain two hydrogen nuclei or protons. When a person goes inside the powerful magnetic field of the scanner, the magnetic moments of some of these protons align with the direction of the field. A radio frequency transmitter is then briefly turned on, producing an electromagnetic field. In simple terms, the photons of this field have just the right energy, known as the resonance frequency, to flip the spin of the aligned protons. As the intensity and duration of the field increases, more aligned spins are affected. After the field is turned off, the protons decay to the original spin-down state and the difference in energy between the two states is released as a photon. It is these photons that produce the signal which can be detected by the scanner. The frequency at which the protons resonate depends on the strength of the magnetic field. As a result of conservation of energy, this also dictates the frequency of the released photons. It is this relationship between field-strength and frequency that allows the use of nuclear magnetic resonance for imaging. Additional magnetic fields are applied during the scan in order to make the magnetic field strength depend on the position within the patient, providing a straightforward method to control where the protons are excited by the radio photons. These fields are created by passing electric currents through solenoids, known as gradient coils. Since these coils are within the bore of the scanner, there will be large forces between them and the main field coils, producing most of the noise that is heard during operation. Without efforts to dampen this noise, it can approach 130 decibels (the human pain threshold) with strong fields . An image can be constructed because the protons in different tissues return to their equilibrium state at different rates. By changing the parameters on the scanner this effect is used to create contrast between different types of body tissue or between other properties, as in fMRI and diffusion MRI. Contrast agents may be injected intravenously to enhance the appearance of blood vessels, tumors or inflammation. Contrast agents may also be directly injected into a joint in the case of arthrograms, MRI images of joints. Unlike CT, MRI uses no ionizing radiation and is generally a very safe procedure. Nonetheless the strong magnetic fields and radio pulses can affect metal implants, including cochlear implants and cardiac pacemakers. In the case of cardiac pacemakers, the results can sometimes be lethal, so patients with such implants are generally not eligible for MRI. MRI is used to image every part of the body, and is particularly useful for tissues with many hydrogen nuclei and little density contrast, such as the brain, muscle, connective tissue and most tumors. APPLICATIONSIn clinical practice, MRI is used to distinguish pathologic tissue (such as a brain tumor) from normal tissue. One advantage of an MRI scan is that it is believed to be harmless to the patient. It uses strong magnetic fields and non- ionizing radiation in the radio frequency range, unlike CT scans and traditional X-rays which both use of ionizing radiation. While CT provides good spatial resolution (the ability to distinguish two structures an arbitrarily small distance from each other as separate), MRI provides comparable resolution with far better contrast resolution (the ability to distinguish the differences between two arbitrarily similar but not identical tissues). The basis of this ability is the complex library of pulse sequences that the modern medical MRI scanner includes, each of which is optimized to provide image contrast based on the chemical sensitivity of MRI. For example, with particular values of the echo time (T E) and the repetition time (TR), which are basic parameters of image acquisition, a sequence will take on the property of T 2-weighting. On a T2-weighted scan, water- and fluid-containing tissues are bright (most modern T 2 sequences are actually fast T2 sequences) and fat-containing tissues are dark. The reverse is true for T 1-weighted images. Damaged tissue tends to develop edema, which makes a T2- weighted sequence sensitive for pathology, and generally able to distinguish pathologic tissue from normal tissue. With the addition of an additional radio frequency pulse and additional manipulation of the magnetic gradients, a T2- weighted sequence can be converted to a FLAIR sequence, in which free water is now dark, but edematous tissues remain bright. This sequence in particular is currently the most sensitive way to evaluate the brain for demyelinating diseases, such as multiple sclerosis. The typical MRI examination consists of 5 –20 sequences, each of which are chosen to provide a particular type of information about the subject tissues. This information is then synthesized by the interpreting physician.
Tuesday, April 6, 2010
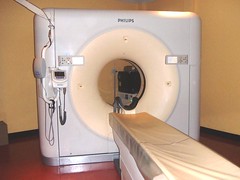
Computed tomography scanner (CT scan)
CT scanner Computed tomography (CT) is a medical imaging method employing tomography created by computer processing. Digital geometry processing is used to generate a three-dimensional image of the inside of an object from a large series of two- dimensional X-ray images taken around a single axis of rotation. CT produces a volume of data which can be manipulated, through a process known as "windowing", in order to demonstrate various bodily structures based on their ability to block the X-ray/Röntgen beam. Although historically the images generated were in the axial or transverse plane, orthogonal to the long axis of the body, modern scanners allow this volume of data to be reformatted in various planes or even as volumetric (3D) representations of structures. Although most common in medicine, CT is also used in other fields, such as nondestructive materials testing. Another example is the DigiMorph project at the University of Texas at Austin which uses a CT scanner to study biological and paleontological specimens. Usage of CT has increased dramatically over the last two decades. An estimated 72 million scans were performed in the United States in 2007. Terminology The word "tomography" is derived from the Greek tomos (slice) and graphein (to write). Computed tomography was originally known as the "EMI scan" as it was developed at a research branch of EMI, a company best known today for its music and recording business. It was later known as computed axial tomography (CAT or CT scan) and body section röntgenography. Although the term "computed tomography" could be used to describe positron emission tomography and single photon emission computed tomography , in practice it usually refers to the computation of tomography from X-ray images, especially in older medical literature and smaller medical facilities. In MeSH, "computed axial tomography" was used from 1977 –79, but the current indexing explicitly includes "X-ray" in the title.Since its introduction in the 1970s, CT has become an important tool in medical imaging to supplement X-rays and medical ultrasonography. It has more recently begun to also be used for preventive medicine or screening for disease, for example CT colonography for patients with a high risk of colon cancer. A number of institutions offer full-body scans for the general population. However, this is a controversial practice, given its lack of proven benefit, cost, radiation exposure, and the risk of finding 'incidental' abnormalities that may trigger additional investigations.
Saturday, April 3, 2010
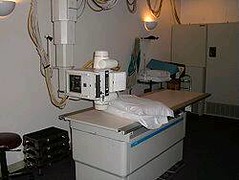
X-ray machine
X-ray machine An X-ray generator is a device used to generate X-rays. These devices are commonly used by radiographers to acquire an x- ray image of the inside of an object (as in medicine or non- destructive testing) but they are also used in sterilization or fluorescence.An X-ray imaging system consists of a X-ray source or generator ( X-ray tube), an image detection system which can be either a film (analog technology) or a digital capture system, and a PACS. X-ray photons are produced by an electron beam that is accelerated to a very high speed and strikes a target. The electrons that make up the beam are emitted from a heated cathode filament. The electrons are then focused and accelerated by an electrical field towards an angled anode target. The point where the electron beam strikes the target is called the focal spot. Most of the kinetic energy contained in the electron beam is converted to heat, but around 1% of the energy is converted into X-ray photons, the excess heat is dissipated via a heat sink. At the focal spot, X-ray photons are emitted in all directions from the target surface, the highest intensity being around 60deg to 90deg from the beam due to the angle of the anode target to the approaching X-ray photons. There is a small round window in the X-ray tube directly above the angled target. This window allows the X-ray to exit the tube with little attenuation while maintaining a vacuum seal required for the X-ray tube operation. X-ray machines work by applying controlled voltage and current to the X-ray tube, which results in a beam of X-rays. The beam is projected on matter. Some of the X-ray beam will pass through the object, while some are absorbed. The resulting pattern of the radiation is then ultimately detected by a detection medium including rare earth screens (which surround photographic film), semiconductor detectors, or X-ray image intensifiers. Detection In healthcare applications in particular, the x-ray detection system rarely consists of the detection medium. For example, a typical stationary radiographic x- ray machine also includes an ion chamber and grid. The ion chamber is basically a hollow plate located between the detection medium and the object being imaged. It determines the level of exposure by measuring the amount of x-rays that have passed through the electrically charged, gas-filled gap inside the plate. This allows for minimization of patient radiation exposure by both ensuring that an image is not underdeveloped to the point the exam needs to be repeated and ensuring that more radiation than needed is not applied. The grid is usually located between the ion chamber and object and consists of many aluminum slats stacked next to each other (resembling a polaroid lens). In this manner, the grid allows straight x-rays to pass through to the detection medium but absorbs reflected x-rays. This improves image quality by preventing scattered (non- diagnostic) x-rays from reaching the detection medium, but using a grid creates higher exam radiation doses overall. Images taken with such devices are known as X-ray photographs or radiographs. X-ray machines are used in health care for visualising bone structures and other dense tissues such as tumours. Non- medicial applications include security and material analysis.The two main fields in which x- ray machines are used in medicine are radiography and dentistry. Radiography is used for fast, highly penetrating images, and is usually used in areas with a high bone content. Some forms of radiography include: orthopantomogram — a panoramic x-ray of the jaw showing all the teeth at once mammography — x-rays of breast tissue tomography — x-ray imaging in sections Radiotherapy — the use of x-ray radiation to treat malignant cancer cells, a non-imaging application Fluoroscopy is used in cases where real-time visualization is necessary (and is most commonly encountered in everyday life at airport security). Some medical applications of fluorography include: angiography — used to examine blood vessels in real time barium enema — a procedure used to examine problems of the colon and lower gastrointestinal tract barium swallow — similar to a barium enema, but used to examine the upper gastroinstestional tract biopsy — the removal of tissue for examination X-rays are highly penetrating, ionizing radiation, therefore X- ray machines are used to take pictures of dense tissues such as bones and teeth. This is because bones absorb the radiation more than the less dense soft tissue. X-rays from a source pass through the body and onto a photographic cassette. Areas where radiation is absorbed show up as lighter shades of grey (closer to white). This can be used to diagnose broken or fractured bones. In fluoroscopy, imaging of the digestive tract is done with the help of a radiocontrast agent such as barium sulfate, which is opaque to X-rays.
Wednesday, March 31, 2010
EEG (Electroencephalography)
Electroencephalography machine Electroencephalography (EEG) is the recording of electrical activity along the scalp produced by the firing of neurons within the brain.In clinical contexts, EEG refers to the recording of the brain's spontaneous electrical activity over a short period of time, usually 20 –40 minutes, as recorded from multiple electrodes placed on the scalp. In neurology, the main diagnostic application of EEG is in the case of epilepsy, as epileptic activity can create clear abnormalities on a standard EEG study.A secondary clinical use of EEG is in the diagnosis of coma, encephalopathies, and brain death. EEG used to be a first-line method for the diagnosis of tumors, stroke and other focal brain disorders, but this use has decreased with the advent of anatomical imaging techniques such as MRI and CT. Derivatives of the EEG technique include evoked potentials (EP), which involves averaging the EEG activity time-locked to the presentation of a stimulus of some sort (visual, somatosensory, or auditory). Event-related potentials refer to averaged EEG responses that are time-locked to more complex processing of stimuli; this technique is used in cognitive science, cognitive psychology, and psychophysiological research.The electrical activity of the brain can be described in spatial scales from the currents within a single dendritic spine to the relatively gross potentials that the EEG records from the scalp, much the same way that economics can be studied from the level of a single individual's personal finances to the macro- economics of nations. Neurons, or nerve cells, are electrically active cells which are primarily responsible for carrying out the brain's functions. Neurons create action potentials, which are discrete electrical signals that travel down axons and cause the release of chemical neurotransmitters at the synapse, which is an area of near contact between two neurons. This neurotransmitter then activates a receptor in the dendrite or body of the neuron that is on the other side of the synapse, the post-synaptic neuron. The neurotransmitter, when combined with the receptor, typically causes an electrical current within the dendrite or body of the post- synaptic neuron. Thousands of post-synaptic currents from a single neuron's dendrites and body then sum up to cause the neuron to generate an action potential. This neuron then synapses on other neurons, and so on. EEG reflects correlated synaptic activity caused by post-synaptic potentials of cortical neurons. The ionic currents involved in the generation of fast action potentials may not contribute greatly to the averaged field potentials representing the EEG . More specifically, the scalp electrical potentials that produce EEG are generally thought to be caused by the extracellular ionic currents caused by dendritic electrical activity, whereas the fields producing magnetoencephalographic signals are associated with intracellular ionic currents.The electric potentials generated by single neurons are far too small to be picked by EEG or MEG.EEG activity therefore always reflects the summation of the synchronous activity of thousands or millions of neurons that have similar spatial orientation, radial to the scalp. Currents that are tangential to the scalp are not picked up by the EEG. The EEG therefore benefits from the parallel, radial arrangement of apical dendrites in the cortex. Because voltage fields fall off with the fourth power of the radius, activity from deep sources is more difficult to detect than currents near the skull. Scalp EEG activity shows oscillations at a variety of frequencies. Several of these oscillations have characteristic frequency ranges, spatial distributions and are associated with different states of brain functioning (e.g., waking and the various sleep stages). These oscillations represent synchronized activity over a network of neurons. The neuronal networks underlying some of these oscillations are understood (e.g., the thalamocortical resonance underlying sleep spindles), while many others are not (e.g., the system that generates the posterior basic rhythm). Research that measures both EEG and neuron spiking finds the relationship between the two is complex with the power of surface EEG only in two bands that of gamma and delta relating to neuron spike activity.A routine clinical EEG recording typically lasts 20 –30 minutes (plus preparation time) and usually involves recording from 25 scalp electrodes. Routine EEG is typically used in the following clinical circumstances: to distinguish epileptic seizures from other types of spells, such as psychogenic non- epileptic seizures , syncope (fainting), sub- cortical movement disorders and migraine variants. to differentiate "organic" encephalopathy or delirium from primary psychiatric syndromes such as catatonia to serve as an adjunct test of brain death to prognosticate, in certain instances, in patients with coma to determine whether to wean anti-epileptic medications At times, a routine EEG is not sufficient, particularly when it is necessary to record a patient while he/she is having a seizure. In this case, the patient may be admitted to the hospital for days or even weeks, while EEG is constantly being recorded (along with time-synchronized video and audio recording). A recording of an actual seizure (i.e., an ictal recording, rather than an inter- ictal recording of a possibly epileptic patient at some period between seizures) can give significantly better information about whether or not a spell is an epileptic seizure and the focus in the brain from which the seizure activity emanates. Epilepsy monitoring is typically done: to distinguish epileptic seizures from other types of spells, such as psychogenic non- epileptic seizures , syncope (fainting), sub- cortical movement disorders and migraine variants. to characterize seizures for the purposes of treatment to localize the region of brain from which a seizure originates for work-up of possible seizure surgery Additionally, EEG may be used to monitor certain procedures: to monitor the depth of anesthesia as an indirect indicator of cerebral perfusion in carotid endarterectomy to monitor amobarbital effect during the Wada test EEG can also be used in intensive care units for brain function monitoring: to monitor for non-convulsive seizures/non-convulsive status epilepticus to monitor the effect of sedative/anesthesia in patients in medically induced coma (for treatment of refractory seizures or increased intracranial pressure) to monitor for secondary brain damage in conditions such as subarachnoid hemorrhage (currently a research method) If a patient with epilepsy is being considered for resective surgery, it is often necessary to localize the focus (source) of the epileptic brain activity with a resolution greater than what is provided by scalp EEG. This is because the cerebrospinal fluid, skull and scalp smear the electrical potentials recorded by scalp EEG. In these cases, neurosurgeons typically implant strips and grids of electrodes (or penetrating depth electrodes) under the dura mater, through either a craniotomy or a burr hole. The recording of these signals is referred to as electrocorticography (ECoG), subdural EEG (sdEEG) or intracranial EEG (icEEG)--all terms for the same thing. The signal recorded from ECoG is on a different scale of activity than the brain activity recorded from scalp EEG. Low voltage, high frequency components that cannot be seen easily (or at all) in scalp EEG can be seen clearly in ECoG. Further, smaller electrodes (which cover a smaller parcel of brain surface) allow even lower voltage, faster components of brain activity to be seen. Some clinical sites record from penetrating microelectrodes.
Subscribe to:
Posts (Atom)